AP Suite 6.3.3 contains one of the most substantial upgrades for AP Suite data acquisition and analysis. We find several usability improvements, new analytical capabilities, and deeper automation.
We’d like to share some new features available to AP Suite users and encourage you to upgrade to the released version 6.3.3.55 to take advantage of them. I’d like to discuss a couple of the interesting features in depth and provide a list of additional features that APT analysts can try for themselves after updating the software.
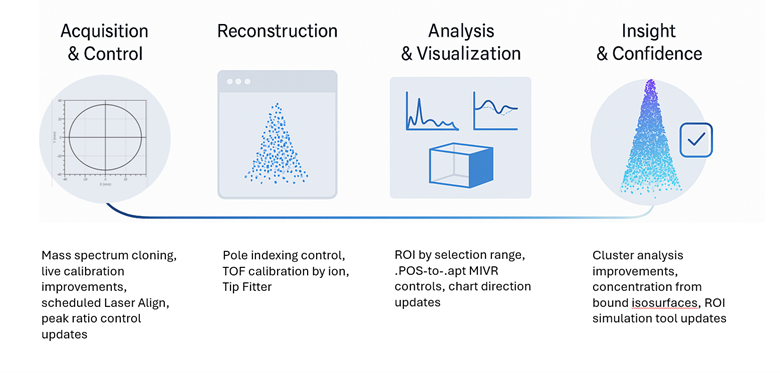
AP Suite 6.3.3 process
AP Suite 6.3.3 also introduces a collection of new ROI capabilities that make chemical and spatial segmentation more useful. Users can now generate ROIs directly from proxigrams or 1D concentration profiles, effectively letting the chemistry define the geometry.
If you have ever struggled to position the ROI with the widget tool to match an interface or define a sub region, you may appreciate this! Figure 1 a-b shows the 1D concentration profile from a larger dataset. By selecting a region of the profile as in Figure 1b, an ROI can be generated from just the selected region for further analysis. This can be isolated as it’s own ROI as shown in Figure 1c.
This data-driven approach dramatically reduces manual trial and error, especially for interface studies, diffusion zones, or precipitates that do not conform to simple geometric shapes. The expansion of ROI arrays to include Z axis slicing further supports multilayered materials and cases where depth-dependent composition is crucial.

Figure 1: (a) shows the full dataset acquired from an ROI of phosphorous doped silicon with a silicon oxide substrate (b) A 1D concentration profile of the evolution of phosphorous concentration throughout the non-uniformly doped sample showing a selection range of more consistent concentration values to create a sub-ROI for analysis (c) detached ROI displayed separately.
Isosurface controls also have some useful improvements. Many times, users are interested in the composition of regions that are bound by a user-set isoconcentration or density values. This can be done quickly and easily now in AP Suite 6.3.3. Figure 2 shows a dataset with a 10 at.% Cu isosurface in an FeCu alloy. The surface defines several fully enclosed or “bound” isosurfaces.
Within the Interface Analysis panel, the composition of each fully enclosed surface can be displayed based on the ranged ions % or another criteria. This allows the composition to be quickly and easily investigated without additional steps, and provides information similar to Solute Analysis/Cluster Search results, but in a much faster manner.

Figure 2: FeCu alloy with 10 at.% Cu isosurface, the bound isosurface composition is displayed in the Interface Analysis panel.
There are also several improvements in the acquisition software, ACC as well as DAVis. For lab managers, a Scheduled Laser Align is enabled, just requiring a pre-sharpened microtip (PSM) loaded into the analysis chamber. This can improve throughput by doing the regular alignments at scheduled times. We have also enabled Auto Laser Scanning to start at a specified detection rate, saving time by limiting laser scans at lower voltages than the threshold for evaporation.
There are many, many other features and improvements that will delight our users. A few of these include:
- Time-of-flight calibration enabling complex ions for calibration by user-selection in the periodic table format, similar to how the ion display list works for complex ions
- Manual pole indexing for ICF calibration, and ability to select only ranged ions to reduce noise
- Cluster analysis defaults have been adjusted to make the default Spatial Basis Solute (Transformed), which is more intuitive as a definition of radii of gyration
- Custom date/time formats for default specimen names Asset Manager will be useful for our many international users
- Mass spectral cloning in DAVis will enable two mass specta visible, making it easier to see both the entire mass spectrum and perhaps a smaller peak of interest simultaneously
- Streamlined ion display lists in DAVis reducing visual clutter
- The ability to change the Autoset limit control in the reconstruction wizard
- Built in POS-to-APT conversion in Data Navigator
- IVAS chart tool box view symbols update to match expected orientations
- Peak ratio plots have enabled fast/medium/slow update rates
- Reset mass spectrum enabled as a DAVIS option, so the detector event histogram doesn’t need to be refreshed if only the mass spectrum is refreshed
- Ability to rename specimens added to Asset Manager, and multiselect microtips to rename all in one step
- Default collapsed Workspace to neaten up the datasets within each Workspace
- ROI simulation tool includes Invizo and 6000 XR peak shape selections in the Time Histogram Model
- Clipping capability and opacity control added to Multi Ion Volume Renderer tool
- Local caching of HITS files during the reconstruction wizard improving processing speed
Taken together, AP Suite 6.3.3 a number of usability improvements, bug fixes, and features to improve APT data analysis.
For researchers stretching atom probe tomography to its limits, and for engineers relying on APT to support material development and production workflows, this release offers a more powerful, more reliable, and more enjoyable environment to work in.
We hope you love this update as much as the CAMECA Applications lab does.
For more information go to the AP Suite 6 page.
Authors: Lazar Vucicevic (Applications Engineer), Katherine RICE (Applications and Market Development Manager)